Grafana Dashboards Manager
At CozyCloud, most of my work orbites around monitoring and supervision. That’s the main reason explaning why I was tasked with dealing with Zabbix supervision on a remote infrastructure we’re setting up, and it also explains why I’ll write some more on monitoring solutions in the future.
As you already know, some of it is done using Zabbix, and the rest of it is done using OVH’s Metrics Data Platform, which, once again, I’ll write about in a future post. Since OVH hosts a Grafana instance to let their customer visualise their data, we use it to do just that. We actually have one dashboard for each kind of metrics we’re sending to the platform, e.g.:
- a dashboard named “Infra” to visualise system metrics from each host in our infrastructure
- a dashboard named “CouchDB” to visualise metrics specific to our CouchDB clusters, including nodes status, databases reads/writes, etc.
- a dashboard named “Cozy Stack” to visualise metrics specific to Cozy, CozyCloud’s product, including the evolution of the number of created instances, resources usage from the stack, etc.
- etc.
I created most of these dashboards myself as part of prototyping and deploying the solution we’re using to push metrics to OVH’s platform (which I won’t be describing here as it deserves its own post). In fact, for my first couple of months working on this task, I was the only person creating, modifying or deleting dashboards in our Grafana organisation.
Then Nicolas started to work with dashboards too, and we stumbled across one big issue: because Grafana doesn’t embed a version control system (aka VCS, i.e. what Git, SVN et al. are), it became quite difficult to work on a dashboard: if a colleague modify a dashboard you’re currently working on, you can only either overwrite their changes, or give up yours (or merge both manually, which can be really painful).
Another situtation where I disliked the lack of a VCS was when I was editing huge and complex WarpScripts: if you save the dashboard with a faulty script by mistake, you’re going to have a very painful time finding it and fixing it. Add to this that the dashboard is actively used by other teams in your company, which adds to pressure you to patch it quickly, and compare that to the easiness of reverting to an older version and investigating calmly.
Considering all the burden this lack could create, I decided to start working on a tool for my team, which I later released as free software as the Grafana Dashboards Manager.
What is it?
The Grafana Dashboards Manager is a tool written in Go aiming at helping you manage your Grafana dashboards using Git. It takes advantage from the fact that Grafana describes a dashboard as JSON, making it easy to save and edit in a file.
Its goal is to let you retrieve your existing dashboards to a Git repository, and then edit them within your local Git repositrory, so merging two versions of the same dashboard doesn’t become a living hell. Once changes have been committed and pushed to the Git repository’s master branch the Grafana Dashboards Manager can handle synchronising the changes with your Grafana instance. And since only the master branch is watched, it means that you can take advantage of Git’s workflows, such as working on a separate branch, then merging it with the master one, either with a Pull/Merge request or not, and only then will its changes be synchronised with Grafana (if you want them to, of course).
So that’s the big picture, now let’s look at how it works. It is split in two part: a puller and a pusher. Basically, the whole thing is thought to work like this:
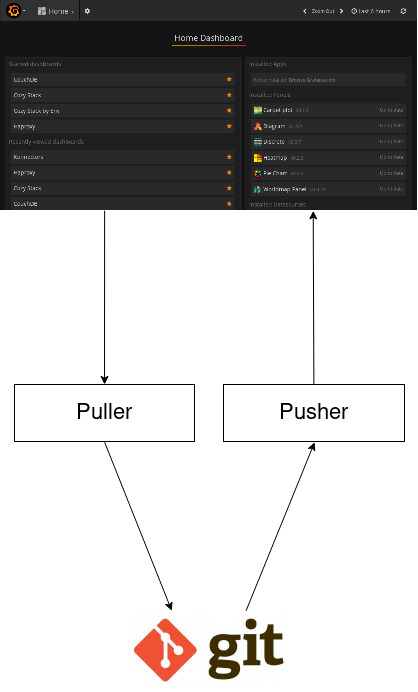
In this schema, the puller, a CLI tool, will fetch changes in the current Grafana dashboards, commit them to a local Git repository, push to a Git remote then exit.
In the meantime, the pusher will look for new commits in the repository to retrieve them and push changed files to Grafana as new or changed dashboards. If requested, it will also delete from Grafana all dashboards that were removed from the Git repository. It will, of course, ignore all commits created by the puller.
This check for new commits can be done in two ways: the first one will start a small web server which will only expose a route that can be used to send web hooks. Because we use GitLab internally, which means our dashboards will be versionned there, the dashboards manager currently only supports GitLab webhooks (and that’s also the reason the Grafana Dashboards Manager uses Git rather than another VCS). Does this mean you can only use the pusher with GitLab, you may ask? Of course not, I answer! The second available mode allows you to specify any Git repository URL which it will poll at a given frequency. In both mode, it will run as a daemon.
By the way, thanks to the refactoring work required to implement this “git pull” mode, if you really want to use a GitHub/Bitbucket/etc. webhook, it shouldn’t be too hard to add support for that in the pusher’s code. Any pull request is, of course, more than welcome!
I don’t want all dashboards to be pulled and pushed, how can I do that?
The configuration allows you to mention a prefix that defines ignored dashboards. If a dashboard’s slug starts with this prefix, it will be ignored by both the puller and the pusher.
Let’s say you want to edit a complex dashboard, which JSON representation is thousands of lines long, so you want to edit it using Grafana’s GUI, using this setting you can change it’s name in the JSON file (which is at the end of the file) so it starts with the given prefix, import it, and you won’t be bothering by the puller committing your WIP changes or the pusher overwriting them.
It’s worth keeping in mind that this “ignore prefix” will be replaced with a regular expression in a future release.
What if I just want a back-up tool?
The reason the Grafana Dashboards Manager is split in two parts is because each is independant from the other. If you want it to work only one way, that’s possible. If you want to use it to only upload JSON descriptions of your dashboards to Grafan, that’s possible. If you want to use it to only back-up your dashboards and push them to a Git repository, that’s possible. Just run the appropriate binary with the appropriate configuration.
Wait, and if I don’t want to use Git at all?
Of course, if you don’t want to get a Git repository involved, the pusher won’t work, since its main feature is to interact with a one.
But if you just want to back-up your dashboards on your disk, well, that’s also possible! The puller has a second mode that only writes files to disk, which is called the “simple sync” mode, and allows you to back-up your dashboards as JSON files on your disk.
I’m sold! How do I get it?
The whole thing is available on GitHub as free software (AGPLv3-licensed), with instructions on how to build it, configure it and run it. If you want to skip the “building” part, here are some built linux-amd64 binaries. All that’s left for you is to download them, create a configuration file from the existing example and run the puller, the pusher or both in the configuration you want.
Thanks a lot to Nicolas who gave me the idea to work on this tool, and to Gilles who gave me a lot of amazing feedback on it 🙂 And as with the latest post, thanks also to Thibaut for his early feedback on this post.
See you next week for a new post, and in the meantime feel free to tweet me some feedback about this one!