Centralising logs with rsyslog and parsing them with Graylog extractors
Once again, we’re up for a monitoring-related post. This time, let’s take a look at logs. Logs are really useful for a lot of things, from investigating issues to monitoring stuff that can’t be watched efficiently by other monitoring tools (such as detailled traffic stats), and some of us even live in a country where it’s illegal to trash logs that were emitted before a given time limit.
When it comes to storing them, a lot of solutions are available, depending on what you need. At CozyCloud, our main need was to be able to store them somewhere safe, preferably outside of our infrastructure.
Earth, lend me your logs! says syslog-dev
We started by centralising logs using rsyslog, an open logs management system that’s described by its creators as a “swiss army knife of logging”. One of its features I’ll be writing the most about in this post is UDP and TCP forwarding. Using that, we (well, my colleagues, since I wasn’t there at that time) created a host for each of our environments which task would be to keep a copy of every log emitted from every host and by every application in the given environment.
I’ll take a quick break here to explain what I mean by “environment” in case it’s not clear: our infrastructure’s architecture is replicated 4 times in 4 different environments, each with a different purpose: dev (dedicated to experimentation and prototyping, aka our playground), int (dedicated to running the developers' integration tests, aka their playground), stg (dedicated to battle-testing features before we push them to the production) and prod (I’ll let you guess what’s its purpose). End of the break.
On each host of the whole infrastructure, we added this line to rsyslog’s configuration:
*.* @CENTRAL_LOG_HOST:514
Here, CENTRAL_LOG_HOST is the IP of the host that is centralising the logs for the given environment, in the infrastructure’s local private network. What it does is to tell rsyslog to forward every log it gets to the given host using UDP on port 514, which is rsyslog’s default port for UDP forwarding.
Then a colleague set up a Graylog instance to try and work out the processing part. He did all the set up and plugged in the dev environment’s logs output before getting drowned under a lot of higher-priority tasks, and since I was just finishing setting up a whole monitoring solution we figured I’d take over from there.
Let’s plug things
Of course, the first thing to do on your own setup is to install and configure Graylog, along with its main dependencies (which are MongoDB and Elasticsearch). The Graylog documentation covers this quite nicely with a general documentation and a few step-by-step guides offering some useful details on installation and configuration. Once your Graylog instance is set up, open your browser on whatever you set as the Web UI’s URI. In most cases, it will look like http://YOUR_SERVER:9000.
Once you’re authenticated, you’ll need to add an input source. Click on “Systems” in the navigation bar, then “Inputs” in the dropdown menu that just appeared. You’ll then be taken to a page from which you’ll be able to configure Graylog’s inputs.
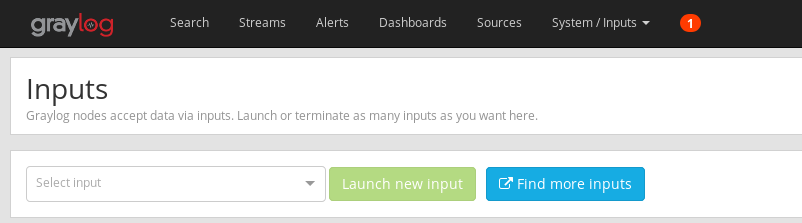
Click on the “Select Input” dropdown, look for “Syslog TCP” and click “Launch new input”. Filling the form that appears then is done accordingly with your needs, however you might want to check “Store full message” at the very bottom. Graylog understands the Syslog protocol’s syntax, and the message it stores is a stripped version of what (r)syslog actually sent. Because you might want to use some of the stripped out parts, it can be wise to tell Graylog to store the full message somewhere before processing it.
You’ll then have to configure rsyslog to send the logs it gets to Graylog. Because we centralise all of our logs, we only need to configure one rsyslog daemon, by adding this line to its configuration:
*.* @@GRAYLOG_HOST:PORT;RSYSLOG_SyslogProtocol23Format
Here, the host is your Graylog server’s address and the port is the one you previously configured while setting up your Syslog TCP input.
There’s two things to notice here. First, there are two @ symbols before Graylog’s host name, which means the logs are going to be forwarded to Graylog using TCP. We previously saw a forwarding configuration line with a single @ sign, which means rsyslog will use UDP. The second thing to notice is the ;RSYSLOG_SyslogProtocol23Format part. The semicolon (;) tells rsyslog that this is a parameter defining how to send logs, and RSYSLOG_SyslogProtocol23Format is a built-in parameter telling rsyslog to send logs using the Syslog protocol as defined in RFC 5424.
Restart rsyslog to apply the new configuration, and check it works by generating some logs while running
tcpdump -Xn host GRAYLOG_HOST and port PORT
with the same values for GRAYLOG_HOST and PORT as in the bit of configuration below. This tcpdump command line can be called from either the Graylog host or the rsyslog host. If those are the same, remember to add -i lo between tcpdump and -Xn to watch the loopback interface (in this case you can also remove the host GRAYLOG_HOST and part of the command line).
Once you’ve created your input, you might want to add streams. I’m not covering this part in this post as I didn’t get to play with these, and there’s a default stream where all messages go anyway.
Now that logs are coming in, let’s process them!
Stranger in a Strange Land
There are several ways to configure logs processing in Graylog. One of them is pipelines, which are, as you can guess by the name, processing pipelines you can plug to a stream. I played around with them a bit, but gave them up quite quickly because I couldn’t figure out how to make them work properly, and I was getting some weird behaviour with their rules editor.
Another way to process logs is to set up extractors. A Graylog extractor is a set of rules which defines how logs coming from a given input will be processed, using one of many possible processing mechanisms, from JSON parsin to plain copy, including splitting, substring, regular expressions or Grok patterns.
Now let’s talk about the latter in case it doesn’t ring a bell, because I’ll be talking a lot about this type of patterns in the rest of the post. Grok patterns are kind of an overlay for regular expressions, addressing the issue of their complexity. I’m sure that, just like me, you don’t find the thought of parsing 300-character long log entries using a custom format with standard regular expressions very exciting.
Grok patterns take the form of a string (looking like %{PATTERN}) you include in your parsing instruction that will correspond to either a plain regular expression, or a concatenation between other Grok patterns. For example, %{INT}, a common pattern matching any positive or negative integer, corresponds to the regular expression (?:[+-]?(?:[0-9]+)). Another pattern, included in Graylog’s base patterns, is %{DATESTAMP} which is defined as %{DATE}[- ]%{TIME}, which is a concatenation between a regular expression and two Grok patterns. These patterns are very useful as they make your parsing instructions way easier to read than if they were only made of common regular expressions.
Graylog, like other pieces of software, allow you to describe a log entry as a concatenation of patterns and regular expressions. For example, here’s the line we’re using to parse Apache CouchDB’s' logs:
%{DATA} %{NOTSPACE:couchdb_user} %{NOTSPACE:couchdb_method} %{NOTSPACE:couchdb_path} %{NUMBER:couchdb_status_code} %{NOTSPACE} %{NUMBER}
Note the colons inside the patterns' brackets followed by lower case text: these are named captures, which means that what’s captured by the pattern with be labelled with this text. In this case, it will create a new field in the log entry’s Elasticsearch document (since Graylog uses Elasticsearch as its storage backend) with this label as the field’s name. We can even tell Graylog to ignore all un-named captures when creating an extractor.
Dissecting logs
The easiest way to create a new extractor is to browse to Graylog’s search, which can be done by clicking to the related button in the navigation bar. There you’ll see a list of all messages sent from your input.
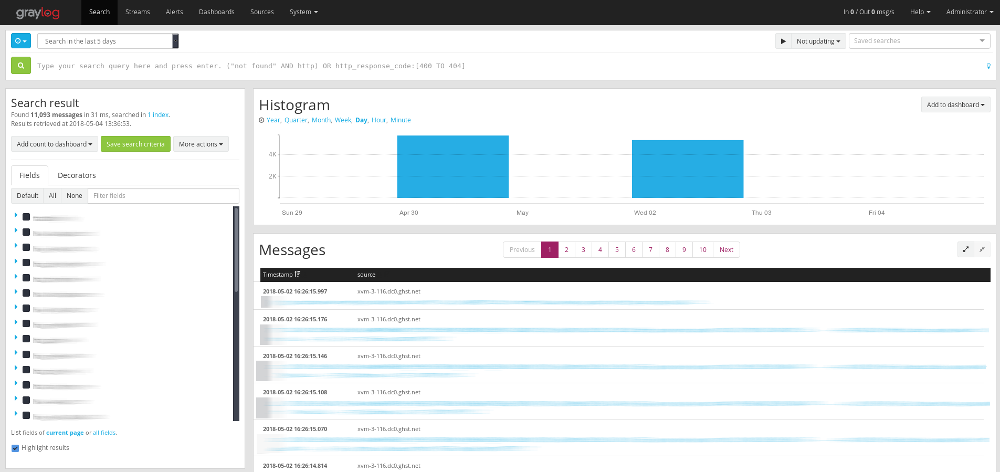
Find a log entry you want to be processed, and click on it. If you have more than one input set up, you might want to double check that the entry come from the input you want to plug the extractor on, in order to avoid plugging it to the wrong input. Now locate the field you want to process (here we’ll use the full_message field, which is only available if “Store full message” is checked in the input’s configuration). Click on the down arrow icon on its right.
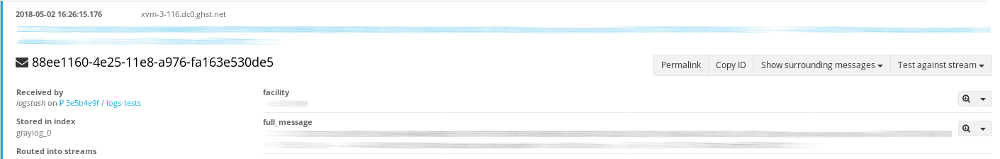
A dropdown menu appears, move your cursor over “Create extractor for field…”. Because that’s close to being the only extractor I got to use while working with Graylog, I’ll only cover extractors using Grok patterns here, so select “Grok pattern”.
Clicking on it will take you to the extractor creation page, using the entry you previously selected as an example to test the extractor against.
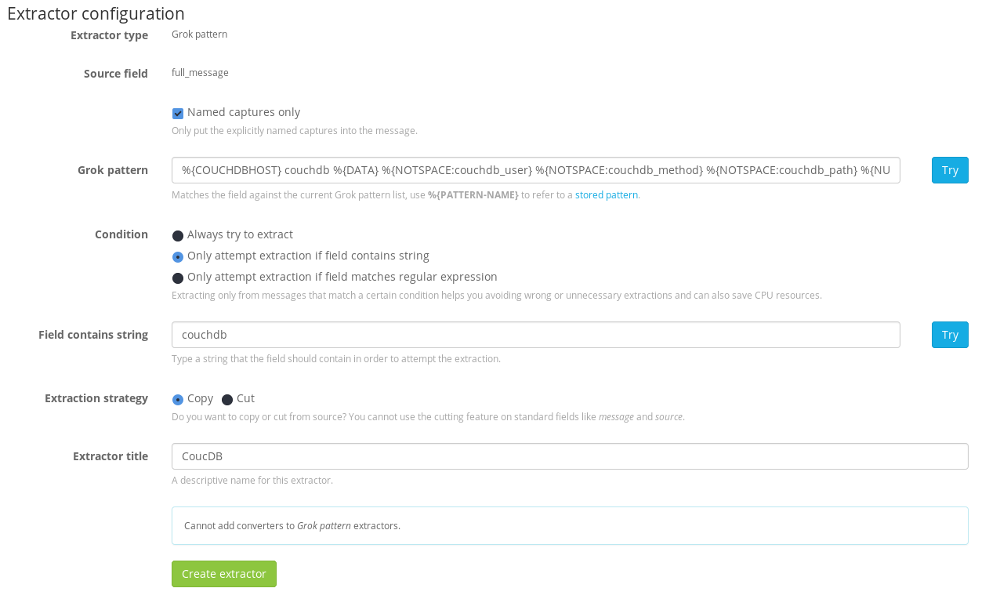
You can then enter your Grok pattern in the “Grok pattern” field. You can even ask Graylog to only extract named captures only by checking the related checkbox.
Now you might think of an issue with this setup: your extractor will be applied against all incoming messages from this input. To tackle that issue, let’s look at two points. First, extractors fail silently, meaning that if a log entry doesn’t match an extractor’s pattern, Graylog will just stop trying this extractor against this specific entry.
Making sure only entries from a specific program and/or host match is the reason we’re creating the exporter for the full_message field, since it contains the original host and the program which emitted the entry at the beginning of the message. These pieces of info are, of course, parsed as soon as the log reaches Graylog and saved in appropriate fields, but Graylog doesn’t allow an exporter to define execution conditions based on other field’s values.
Using values contained in the full_message field, the Grok pattern parsing CouchDB log entries I used as an example above now looks like:
%{COUCHDBHOST} couchdb %{DATA} %{NOTSPACE:couchdb_user} %{NOTSPACE:couchdb_method} %{NOTSPACE:couchdb_path} %{NUMBER:couchdb_status_code} %{NOTSPACE} %{NUMBER}
Now that’s a first step, but it still means every log entry will be tested against the pattern, which is a waste of CPU resources. That’s where my second point comes in.
Graylog allows you to set some basic conditions that will define whether a log entry must be tested against the pattern. You can check whether the field contains a given string, or matches a given regular expression which can be very basic. I chose the string check because of lack of time, but I’d recommand checking against a basic regular expression to better match the log entries you want to target.
One last thing to chose is the “Extraction strategy”, which I usually set to “Copy” to better comply with the WORM (Write Once, Read Many) philosophy. You must also set a name to the extractor so you can easily identify it in the list of existing extractors.
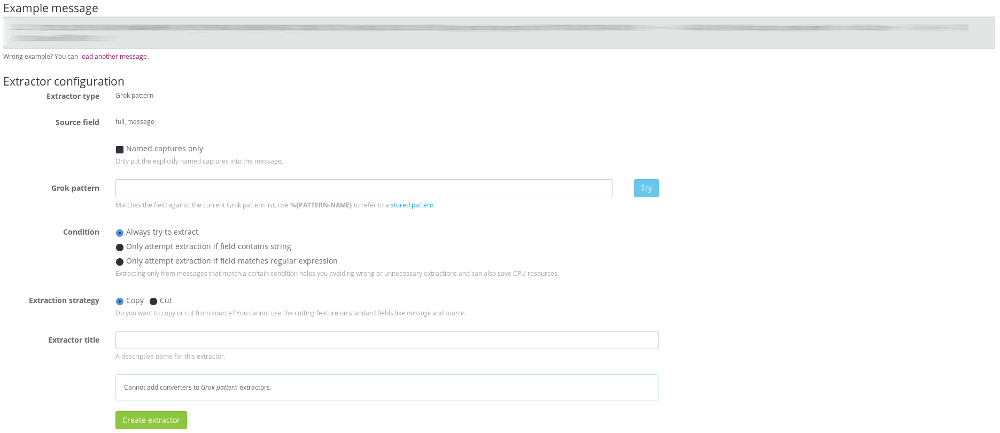
Now your extractor should look like this:
All that’s left to do is to click “Create extractor” and that’s it! Your extractor is up and running!
You might want to check if it runs correctly by going back to the “Search” page and selecting a log entry the extractor should target. If the extractor ran correctly, you should see your new fields added to the entry. Note that an extractor only run against entries received after its creation.
If you want to edit an extractor, click on the “System” link in the navigation bar, the select “Inputs” in the dropdown menu that appears then. Locate the input your extractor is plugged to, and click on the blue “Manage extractors” button next to it. You’ll then be taken to a list of existing extractors for this input:
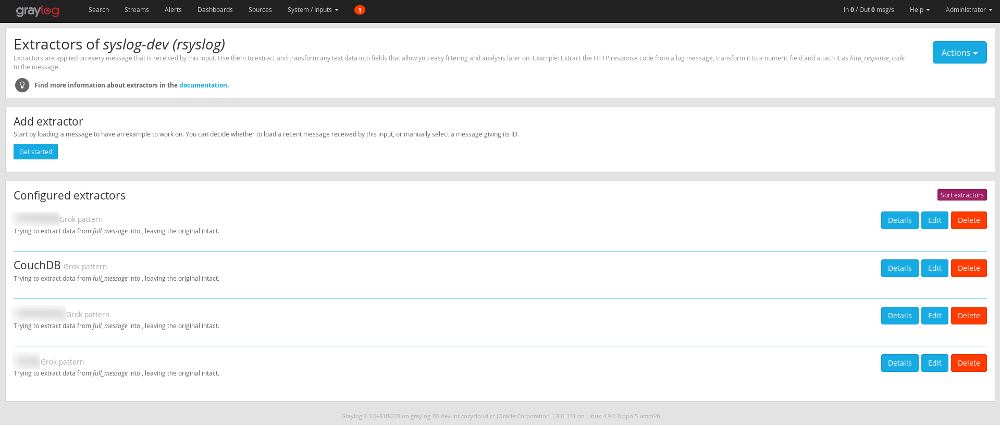
Click “Edit” next to the extractor you want to edit and you’ll be taken to a screen very similar to the creation screen, where you’ll be able to edit your extractor.
In the next episode
Now, we have a copy of all of our logs at the same place, and process them at a single location in our infrastructure, which is great but creates a sort-of SPOF (single point of failure). Well, only partial, since the logs are only copied from their original hosts, so if something happen to one of these locations, “only” the processing can be permanently impacted. Anyway, it doesn’t address one of our needs, which is to do all this outside of our infrastructure.
But this is a story for another week, since this post is already quite long. Next time I’ll tell you about logs, we’ll see how we moved our logs processing and forwarding to a remote service, without losing all the work we did with rsyslog and Graylog. This won’t be next week, though, because I already have next week’s topic, and it’s not even monitoring-related!
Anyway, thanks for bearing with me as I walked you through an interesting (I hope) journey into logs processing. If you’re note aware of it, this post was part of my One post a week series, in which I challenge myself to write each week a whole blog post in order for me to re-evaluate the knowledge I have and get better at sharing it. If you’ve enjoyed it, or if you have any feedback about it, make sure to hit me up on Twitter, I’ll be more than happy to discuss it with you 🙂
Thanks to Thibaut and Sébastien for giving this post a read before I got to publish it and getting me some nice feedback.
See you next week!